 Learn Metallurgy
mail@learnmetallurgy.com
The phase diagrams which based on two components system are called binary phase diagrams
Here, the two compenents can be mixed in a infinite number of different proportions, that is why, composition also becomes a variable apart from pressure and temperature. Depending on the nature (i.e., the crystal structure, the size of atoms, electronegativity, valancy etc.) of these two elements involved, several types of binary equilibria can occure -
Isomorphous systems are the simplest form of binary phase diagram. This types of system shows a complete solubility of each other in solid phase as well as in liquid phase. Hence forms a single phase in both solid and liquid phase. These diagrams are called 'isomorphous' because only a single type of crystal structure is obtained at the all possible compositions.
Examples : Cu-Ni, Au-Ag, Au-Cu, Mo-W, Mo-Ti etc.

In a single phase region, it is quite straight forward to determine the chemical composition of that phase at a given temperature. For example, at 900oC and 50 wt.% Ni, the \( \alpha \) phase have 50 Cu and 50 Ni (wt. %). But things get complicated when we move to two phase region ( \( \alpha + L \) ). At 1300oC and 50 wt.% Ni, we can not directly determine the composition of liquid phase (L) and, composition of solid phase (\( \alpha \)). So here we draw a line parallel to composition axis at the desired temperature known as the tie line and, the intersection points of tie line with liquidus and solidus line will give use the chemical composition of the respective phases.
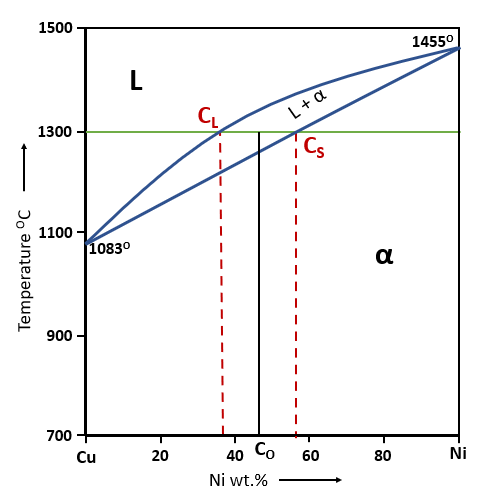
As in the above Cu-Ni phase diagram, a tie line (green color) is drawn at the temperature of 1300oC. The tie line cuts liquidus at CL point and solidus at CS. Hence, for an Cu alloy containing 50 wt.% Ni at 1300oC will have two phases \( \alpha \textrm{ and } L\). Furthermore, the \( \alpha \) phase will have Ni composition of CS wt%, and the liquid phase will have Ni composition of CL wt%.
The relative amount of phases present in a two phase region at a specific temperature can be determined by the lever rule. The lever rule obtained from two principles -

The above diagram shows a part of Cu-Ni phase diagram. Here, applying the lever rule to know the amount of phases present in the alloy (27 Ni, 73 Cu) at 1200oC.
In this type of alloy system, the two components are completely soluble in liquid state but completely insoluble in each other in solid phase. As there are only few numbers of alloy system which can satisfy one, or more Hume Rothery rules, therefore such type of alloy system doesn't show substitutional solid solubility.
Examples : Pb-As, Bi-Cd, Au-Si
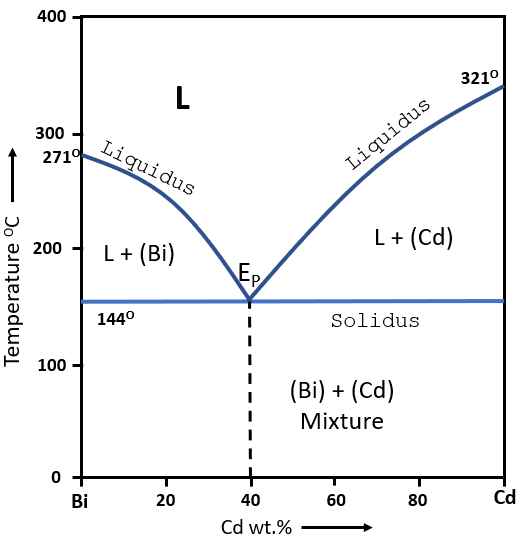
The above figure shows a eutectic phase diagram of Bi - Cd alloy. The elements of alloy are completely insoluble in each other in solid state. At all the composition, the solidification occures over a range except a certain composition which shows solidifiaction at a fixed temperature of 144oC. The alloy (60% Bi, 40% Cd) called eutectic alloy which shows a solidification at a single temperature of 144oC. The eutectic reaction is given as -
In this type of alloy system, the two components are completely soluble in liquid state, and partial soluble in solid phase. Since most of the metal show limited solid solubility in each other, so these type of phase diagram become most common and important.
Examples : Pb-Sn, Cu-Ag, Pb-Sb, Cd-Zn, Sn-Bi

The above figure shows a eutectic phase diagram of Pb - Sn alloy. The solid phase at the left-end of phase diagram is a Pb-rich \( \alpha \) phase, which is the solid solution of Sn in Pb. \( \alpha \) dissolves only a limited amount of tin. In the same way, the solid phase at the right-end is a Sn-rich \( \beta \) phase, which is the solid solution of Pb in Sn. These two solid solution at the end is known as terminal solid solution.
The above Pb-Sn diagram, the \( \alpha \textrm{ and } \beta \) have terminal solid solubility of 19% and 97.5% respectivity. The liquidus line shows a minima at point 'EP', where solidus and liquidus line merage and become a single point, which is known as eutectic point and at this point, liquid solidify at a single temperature. At the eutectic temperature, the following eutectic reaction occures as -

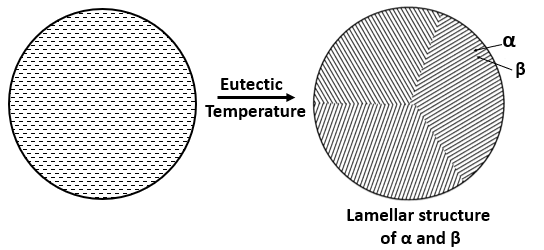
On cooling an eutectic alloy, the solid product will be the mixture of two solution, \( \alpha \textrm{ and } \beta \) and, will form a inter-lamellar structure which have thin and, parallel plates of alternate \( \alpha \) and \( \beta \) crystals. The fraction of \( \alpha \textrm{ and } \beta \) phase in the mixture can be determine by using the lever rule.
 \[ \alpha \textrm{ phase wt.% in eutectic mixture} = \frac{97.5 - 61.9}{97.5 - 19} \times 100 = 45.35\% \]
\[ \beta \textrm{ phase wt.% in eutectic mixture } = \frac{61.9 - 19 }{97.5 - 19} \times 100 = 54.65\% \]
\[ \alpha \textrm{ phase wt.% in eutectic mixture} = \frac{97.5 - 61.9}{97.5 - 19} \times 100 = 45.35\% \]
\[ \beta \textrm{ phase wt.% in eutectic mixture } = \frac{61.9 - 19 }{97.5 - 19} \times 100 = 54.65\% \]
Microstructural changes during cooling of hyper-eutectic (above eutectic composition ) alloy
On cooling a hypereutectic alloy (20%Pb, 80%Sn) under equlibrium conditions. temperature is aabove the liquidus then it will form a single liquid phase as shown in figure (a). At a temperature below liquidus, solidification starts with a formationof a very small solid phase knowns as PRO-eutectic \( \beta \) (because this solid phase is forming before the eutectic temperature). At a lower temperature T1, the amount of \( \text{proeutectic } \beta \) phase will increase. Its composition is now different and can be determined by drawing a tie-line at the T1 temperature as shown by the green line in the phase diagram. The microstructure at temperature T1 will look like as shown in figure (b).

Just above eutectic temperature, the quantity of proeutectic \( \beta \) will be at its max. and the overall proeutectic - \( \beta \) phase can be obtained by drawing tie-line at eutectic temperature.
On futher cooling to just below the eutectic temperature, the remaining liquid will transform according to eutectic reaction (i.e, form lamellar structure) as discussed above. The final microstructure as shown in figure (c), will contain large equiaxed (or same size) crystal of proeutectic \( \beta \), that is, \( \beta \) formed just before the eutectic temperature or eutectic reaction, and the matrix will be eutectic mixute consisting of thin and, parallel plates of alternate \( \alpha \) and \( \beta \) crystals.
Similar to eutectic inverient reaction, this type of inverient reaction occures entirely in the solid state, where a single solid phase gets transform to mixture of two solid phase.
Example : Ag-Cd, Al-Mn, Au-Zn, Cu-Zn, Cu-Sn, Cu-Si
The eutectoid reaction is given by -
When the melting points of the components are differ vastly from each other than a peritectic phase diagram may form. In this type of syatem, a two phase mixture of a liquid and a solid transform to a single phase solid.
Example : Ag-Pt
The peritectic reaction is given by -
| # | Name | Invarient raction |
|---|---|---|
| 1 | Eutectic | \( L \longrightarrow \alpha + \beta \) | 2 | Eutectoid | \( \gamma \longrightarrow \alpha + \beta \) | 3 | Monotectic | \( L_1 \longrightarrow L_2 + \alpha \) | 4 | Peritectic | \( L + \alpha \longrightarrow \beta \) | 5 | Peritectoid | \( \gamma + \alpha \longrightarrow \beta \) | 6 | Syntectic | \( L_1 + L_2 \longrightarrow \alpha \) |
LearnMetallurgy.com is dedicated to providing you unique and in-depth knowledge of the Metallurgical world. We regularly post blogs related to metallurgical field,jobs updates, and Provide Free Speed Test for GATE and PSUs.
Bengaluru, Karnataka
mail@learnmetallurgy.com
© 2021. All Rights Reserved. Sitemap Privacy Policy Term And Conditions Cancellation and Refund Policy